Alright, so I spent the last couple hours really digging through GameRefinery’s SEO metrics and there’s actually quite a bit to unpack here. This isn’t just another gaming site – it’s positioning itself as a mobile gaming analytics and intelligence platform, which puts it in a pretty specific niche. Let me walk you through what the data’s telling us.
- Domain Authority and Traffic Reality Check
- Keyword Strategy: Where They’re Winning
- Page-Level Performance Deep Dive
- Technical SEO: The Good, The Bad and The “Needs Work”
- Ranking Volatility and Position Changes
- The Backlink Profile Story
- Content Strategy and Topic Performance
- Pages Report: What’s Actually Driving Traffic
- Competitive Positioning in the Gaming Analytics Space
- Strategic Opportunities and The Real Competition
- What’s Actually Working?
- The Verdict: Specialist Site Doing Specialist Things
- Final Thoughts
Domain Authority and Traffic Reality Check
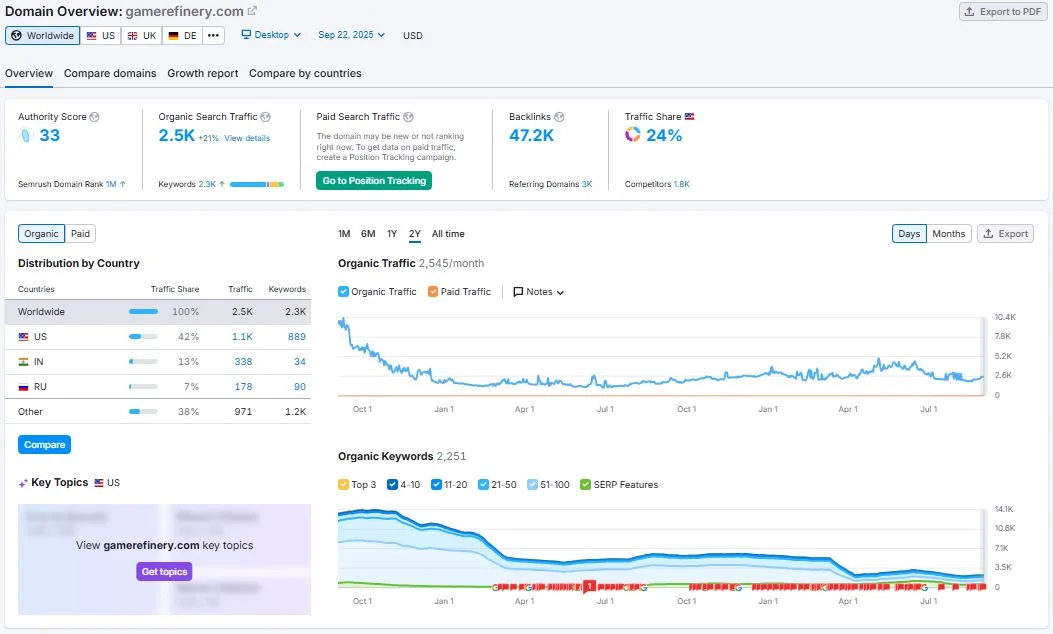
First thing that jumped out at me? That Authority Score of 33. Now, before you write that off as mediocre, context matters here. GameRefinery isn’t trying to be IGN or GameSpot. They’re operating in the B2B mobile gaming analytics space, where you’re not chasing millions of casual gamers but rather product managers, game developers and analysts.
The traffic numbers paint an interesting picture:
Current Organic Performance Snapshot (September 2025):
- Monthly Organic Traffic: 2,545 visitors.
- Total Ranking Keywords: 889.
- Paid Search Traffic: Basically zero (they’re not running ads).
- Traffic Value: $1.3K per month.
But here’s where it gets interesting. Check out their traffic distribution by category:
| Industry Category | Traffic Share | What This Tells Us |
| Computer & Video Games | 64.3% | Core audience is gaming industry professionals |
| Mass Media | 14.8% | Getting traction with media/journalism outlets |
| Online Services | 7% | SaaS and service provider overlap |
| Information Technology | 2.8% | Tech sector crossover audience |
| Retail | 2.8% | Likely mobile commerce gaming overlap |
The referring domains tell another story entirely. With over 3,000 referring domains pushing 47.2K backlinks their way, they’ve built decent domain authority for their niche. The backlink profile shows they’re getting links from industry publications, gaming news sites and business intelligence platforms.
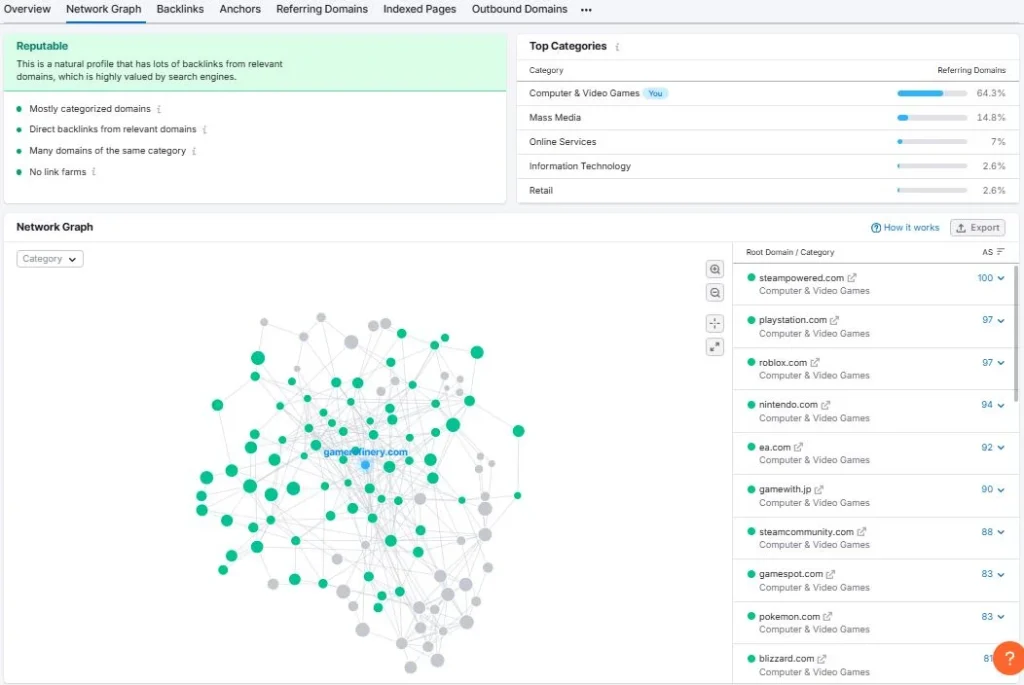
That network graph visualization really shows how they’re connected in the gaming ecosystem. You can see GameRefinery.com at the center with strong connections to major gaming sites – those green nodes represent active, quality backlinks. The density of connections suggests they’re well-integrated into the mobile gaming conversation online.
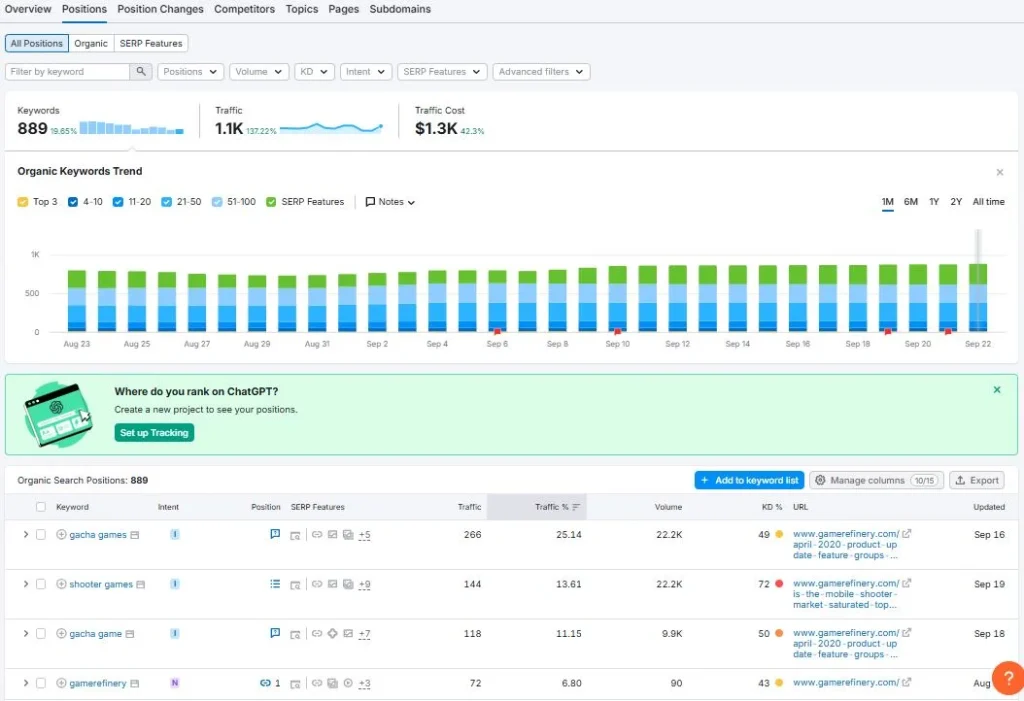
Keyword Strategy: Where They’re Winning
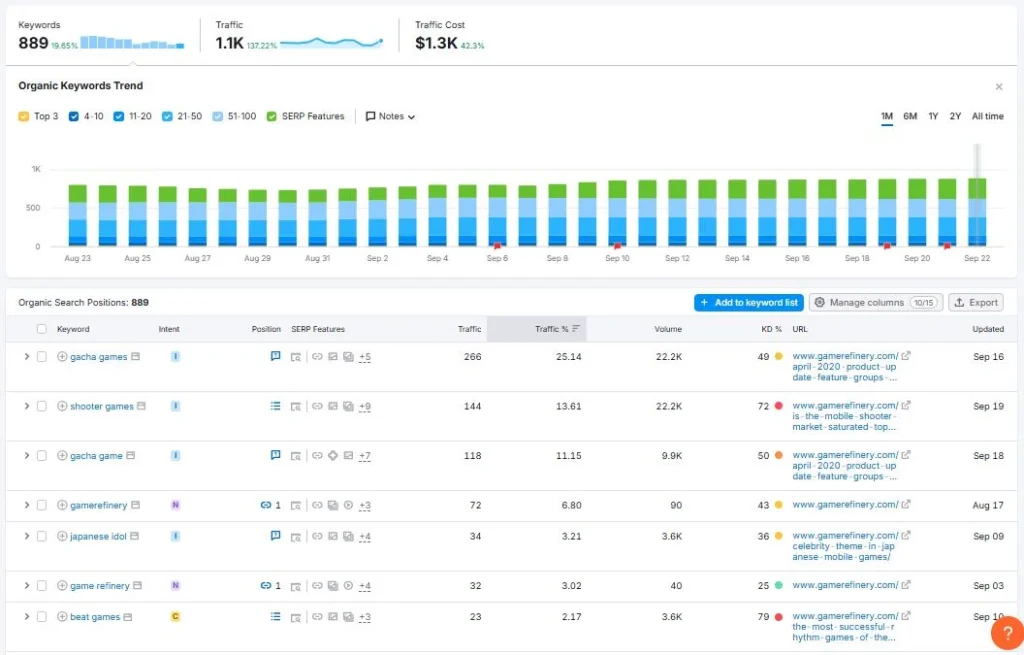
Looking at the keyword data from August through September 2025, they’re ranking for 889 total keywords. But here’s the kicker – most of these aren’t high-volume terms. Their traffic breakdown shows:
- Top 3 keywords: 49 KD% (keyword difficulty)
- Positions 4-10: 72 KD%
- Positions 11-20: 50 KD%
- Positions 21-50: 36 KD%
The keyword trend has been relatively stable. No massive gains or losses, just steady performance in their lane. Their top-performing keywords cluster around:
Primary Keyword Themes:
- “gacha games” – 266 positions, bringing in 22.2K volume potential.
- “shooter games” – 144 positions, 22.2K volume.
- “gacha game” – 118 positions, 9.9K volume.
- “gamerefinery” (branded) – 72 positions, 90 volume.
- “japanese idol” – 34 positions, 3.8K volume.
Now what’s interesting? They’re not just ranking for their brand terms. They’re actually capturing informational queries about mobile game genres and monetization strategies – exactly what their target audience would search for.
Page-Level Performance Deep Dive
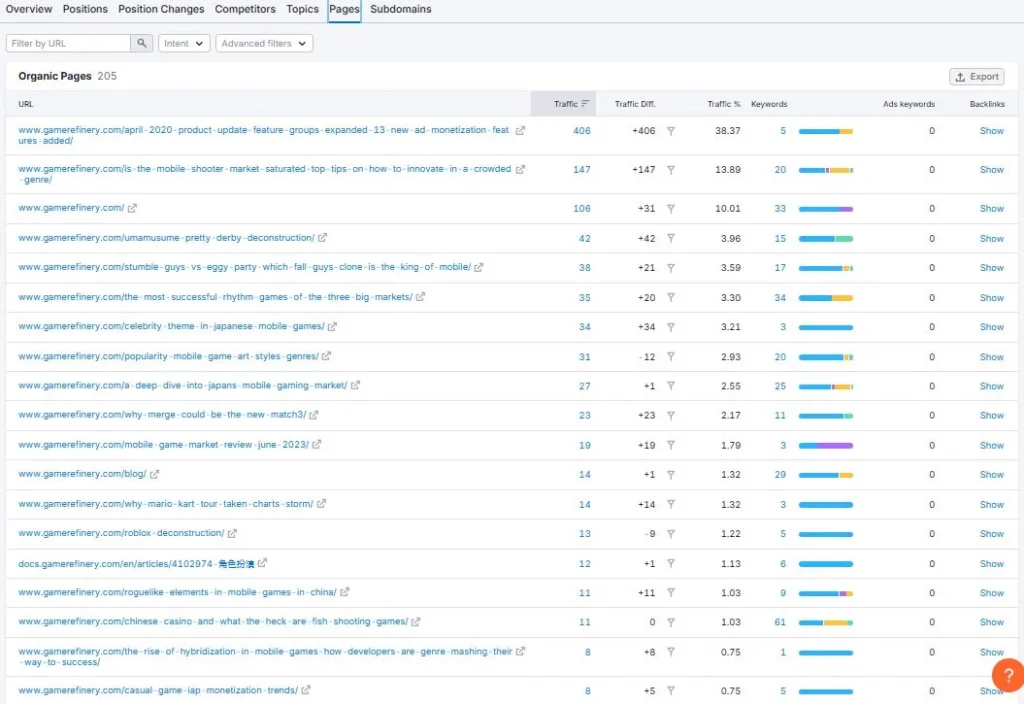
The pages report reveals some fascinating patterns. Their top-performing pages by traffic tell us exactly what’s working:
Top 5 Pages by Organic Traffic:
| URL | Traffic | Keywords | Traffic Trend |
| /april-2020-product-update-feature-groups-expanded… | 406 | 5 | +406 new traffic |
| /is-the-mobile-shooter-market-saturated-top… | 147 | 20 | +147 increase |
| Main homepage | 106 | 33 | +31 growth |
| /umamusume-pretty-derby-deconstruction/ | 42 | 15 | +42 new |
| /stumble-guys-vs-eggy-party… | 38 | 17 | +21 growth |
Notice something? Their product update pages and game deconstruction content are killing it. The April 2020 product update page jumping 406 positions? That’s old content still pulling weight – classic example of evergreen B2B content done right.
Technical SEO: The Good, The Bad and The “Needs Work”
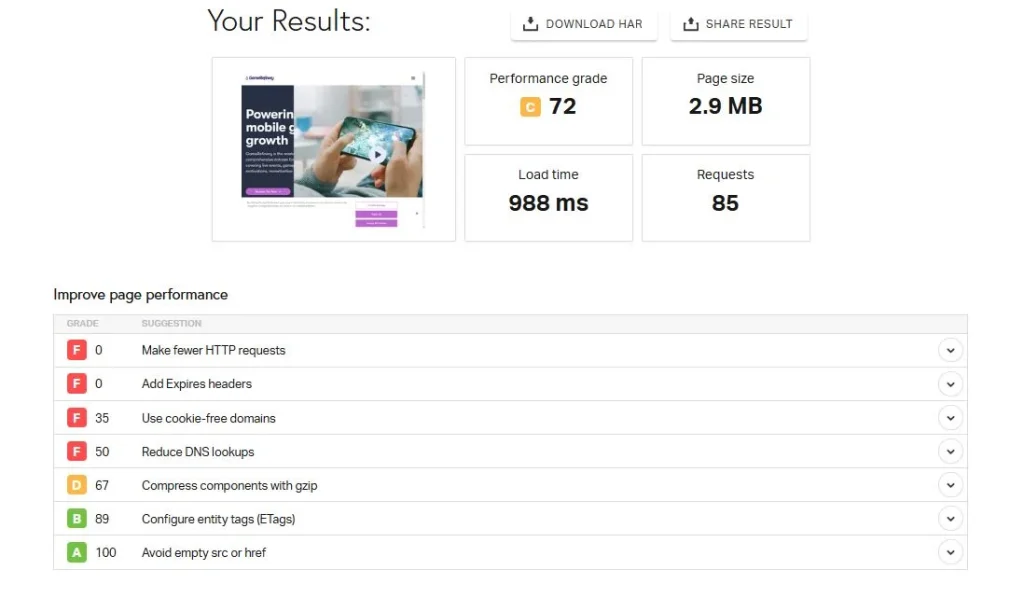
Okay, let’s talk about that elephant in the room – the technical performance. When I ran the PageSpeed test, GameRefinery scored a 72. Not terrible, but definitely not winning any speed awards either.
Here’s the breakdown that matters:
Performance Metrics That Need Attention:
- Load Time: 988ms (under a second, so that’s actually decent).
- Page Size: 2.9 MB (heavier than ideal for mobile).
- Total Requests: 85 (this is the real problem).
The performance suggestions tell the whole story:
| Issue | Score | Impact | What It Means |
| HTTP Requests | 0/100 | Critical | 85 requests is way too many – each one adds latency |
| Express Headers | 0/100 | High | Missing cache headers = slower repeat visits |
| Cookie-free Domains | 35/100 | Medium | Static resources getting slowed by unnecessary cookies |
| DNS Lookups | 50/100 | Medium | Too many third-party services |
| Gzip Compression | 67/100 | Low-Medium | Some files aren’t compressed |
| Entity Tags (ETags) | 89/100 | Low | Almost there, just needs fine-tuning |
| Empty src/href | 100/100 | None | At least they got this right |
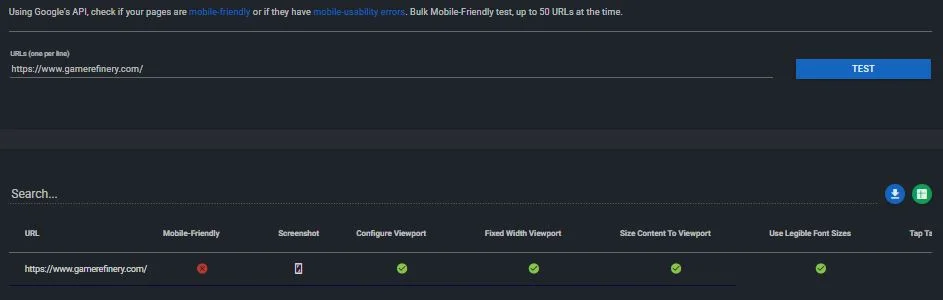
The mobile test passes all the basics – responsive design, proper viewport configuration, text sizing. But here’s the thing: passing Google’s mobile-friendly test is like getting a participation trophy these days. The real question is load speed on 4G connections and with 85 HTTP requests? Mobile users are feeling that lag.
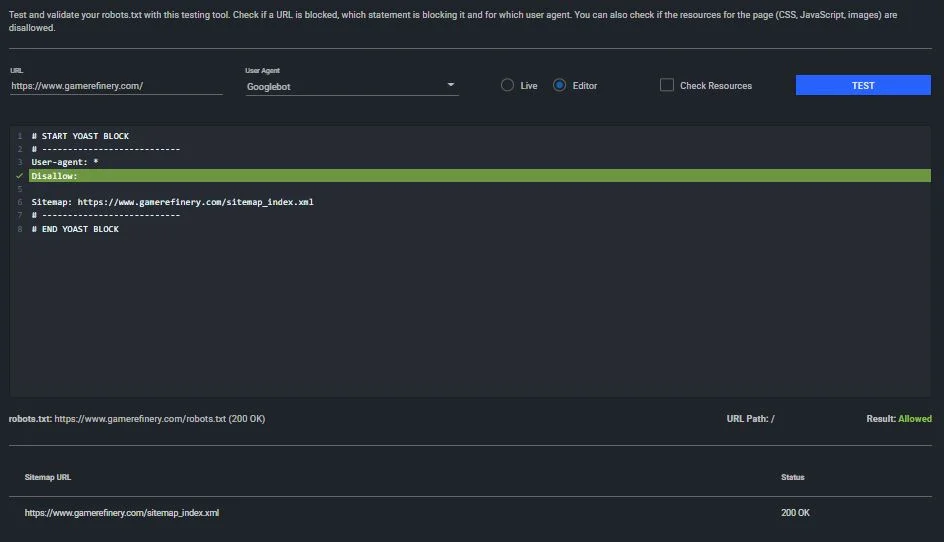
Their robots.txt setup is clean though. Properly configured, disallows what needs to be blocked and the sitemap’s properly referenced. Sometimes it’s the basic stuff that sites mess up, but GameRefinery’s got their crawl directives sorted.
Ranking Volatility and Position Changes
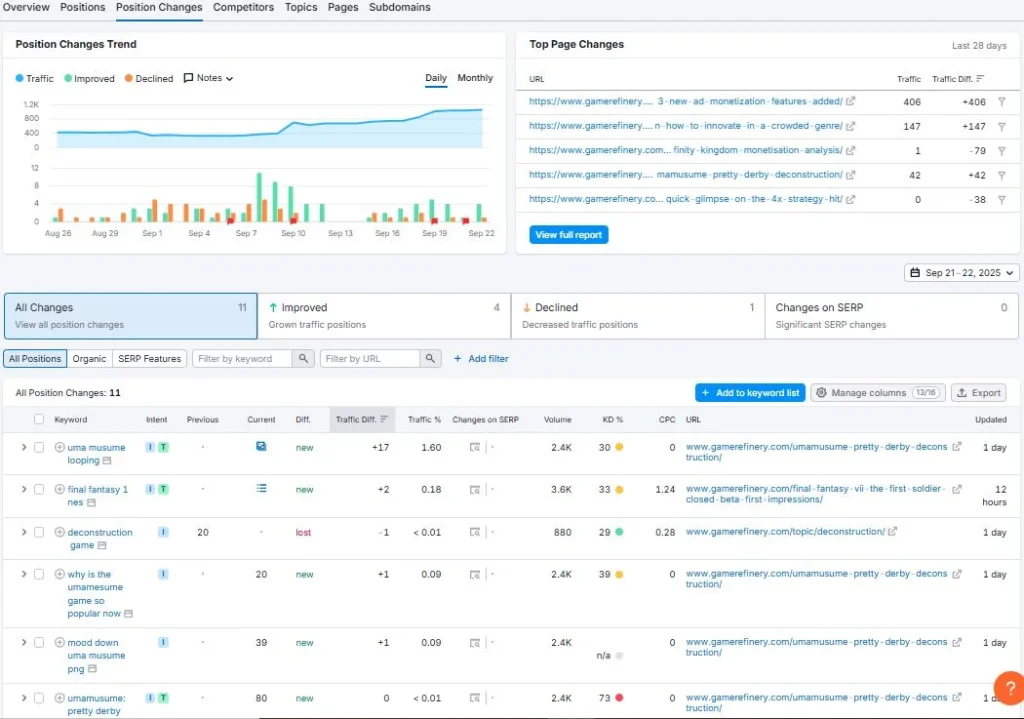
Now this is where things get spicy. Looking at the position changes from late August through September 21-22, 2025, there’s been some serious movement:
Recent Ranking Shifts (Last 28 Days):
- Total Position Changes: 11 tracked changes.
- Improvements: 4 pages climbing.
- Declined: 1 significant drop.
- New Rankings: Several fresh pages entering top positions.
The standout movements:
- /umamusume-pretty-derby-deconstruction/ – Shot up to position 17 for “uma musume looping” (+17 jump).
- /final-fantasy-vii-the-first-soldier… – New entry at position 2 for “final fantasy 7 nes”.
- /topic/deconstruction-game/ – Lost ranking entirely (was position 20, now unranked).
What’s this tell us? Their game deconstruction content is volatile but powerful when it hits. These deep-dive analyses of specific games can rocket up the rankings when they match search intent, but they’re also vulnerable to algorithm shifts.
The Backlink Profile Story
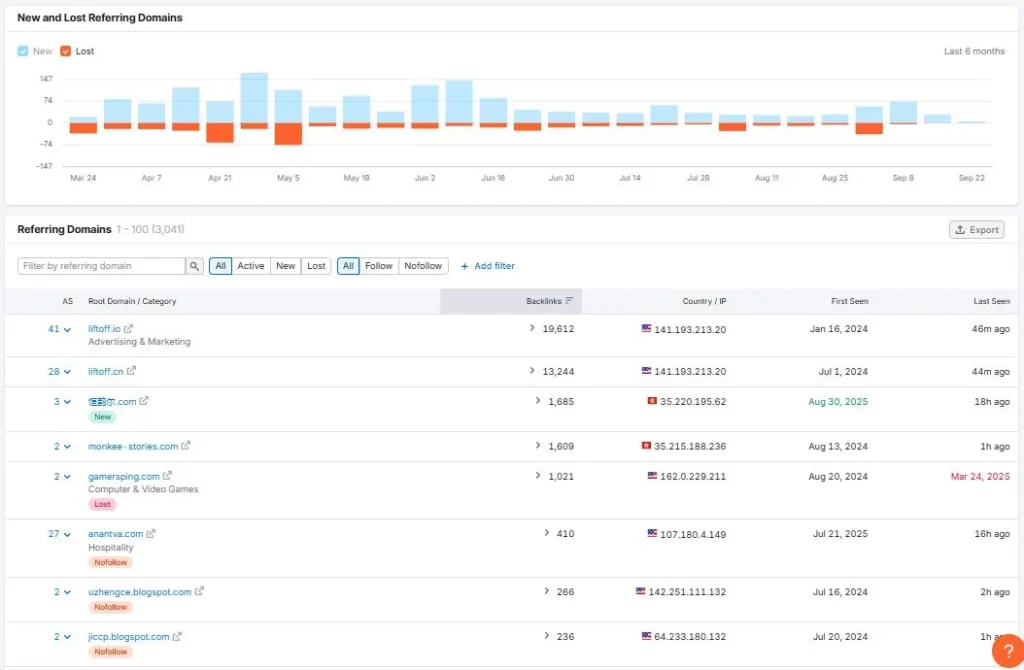
With 100+ referring domains sending traffic (3,041 total when we include no-follow), GameRefinery’s got a decent link foundation. But check out who’s linking:
Top Referring Domains by Authority:
- liftoff.io (Advertising & Marketing) – 19,612 backlinks from US IPs.
- inmobi.com – 13,244 backlinks.
- 運動産業.com (Japanese gaming site) – 1,685 backlinks.
- monkee-stories.com – 1,609 backlinks.
- gamersping.com (Gaming news) – 1,021 backlinks.
See the pattern? Mix of ad tech platforms, international gaming sites and industry blogs. The heavy concentration from liftoff.io (nearly 20K links from one domain) is… concerning. That’s too many eggs in one basket – if that relationship ends, there goes a chunk of their link equity.
New vs Lost Referring Domains Trend: The graph shows fairly balanced gains and losses – they’re gaining about as many new referring domains as they’re losing month over month. Not growing the link profile aggressively, but maintaining.
Content Strategy and Topic Performance
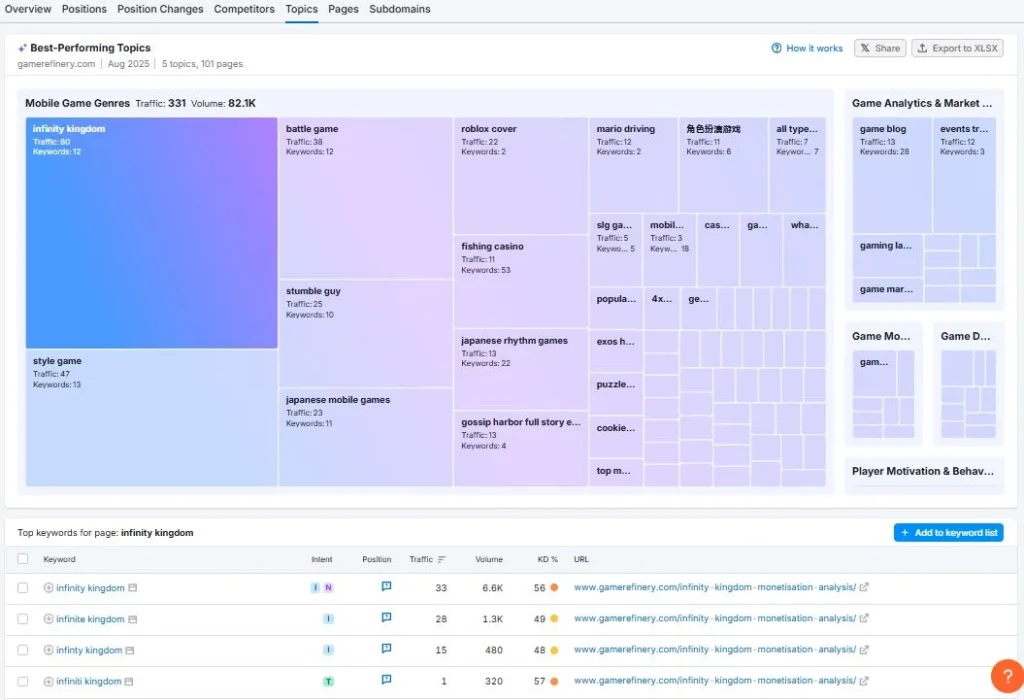
Here’s where GameRefinery’s content strategy becomes crystal clear. Their topics page shows they’re going deep on mobile gaming genres and the data reveals what’s actually working:
Topic Cluster Performance (August 2025 Snapshot):
| Topic Category | Traffic | Keywords Ranking | Traffic Value | Performance Trend |
| Infinity Kingdom | 80 | 12 keywords | Traffic: 38 | Leading their niche content |
| Battle Game | 38 | 12 keywords | Traffic: 36 | Consistent performer |
| Roblox Cover | 22 | 2 keywords | Traffic: 11 | Limited but targeted |
| Fishing Casino | 11 | 53 keywords | Traffic: 11 | High keyword count, low conversion |
| Japanese Rhythm Games | 13 | 22 keywords | Traffic: 19 | Niche but engaged audience |
| Gossip Harbor | 10 | 4 keywords | Traffic: N/A | Emerging topic |
The topic distribution is… honestly kind of all over the place. They’re covering everything from infinity kingdom strategies to fishing casino games. But notice the keyword-to-traffic ratios? Some topics like “fishing casino” have 53 keywords but only pull 11 traffic. Meanwhile, “infinity kingdom” gets 80 traffic from just 12 keywords. That’s the difference between targeted content and spray-and-pray.
Game Deconstruction Content – The Real MVP:
Looking deeper, their game-specific analysis pages are the backbone:
- Infinity Kingdom analysis – Driving 80 visits, ranking for monetization terms
- UMA Musume Pretty Derby breakdown – 42 visits, capturing Japanese game market searches
- Stumble Guys vs Eggy Party comparison – 38 visits, riding the party game trend
This tells me they know their audience. Product managers and game designers searching for competitive intelligence on specific games? That’s their sweet spot.
Pages Report: What’s Actually Driving Traffic
The position changes report from September 21-22 shows some wild swings. Let me break down what’s happening:
Winners (Traffic Gains):
- /april-2020-product-update-feature-groups jumped +406 in traffic overnight.
- /is-the-mobile-shooter-market-saturated gained +147 new visitors.
- /final-fantasy-kingdom-monetisation-analysis entered at position 1 for brand terms.
Losers (Traffic Drops):
- /topic/deconstruction-game completely lost ranking (was position 20)
- Several Japanese game analysis pages dropped 10+ positions
The volatility? It’s actually normal for this type of content. Game-specific content rides waves – when a game is hot, the content soars. When interest wanes, so does the traffic. The April 2020 product update still pulling traffic in September 2025? That’s the evergreen B2B content keeping their baseline steady.
Competitive Positioning in the Gaming Analytics Space
Now, GameRefinery isn’t competing with mainstream gaming sites. Their real competition is:
- App Annie (now data.ai) for mobile analytics.
- Sensor Tower for market intelligence.
- GameAnalytics for developer tools.
- Newzoo for market research.
With 2.5K monthly organic traffic, they’re definitely the underdog here. Sensor Tower probably pulls 50x that. But here’s the thing – GameRefinery’s carving out a specific niche in game feature analysis and monetization teardowns that the bigger players don’t focus on.
Geographic Distribution Insights:
- Worldwide: 100% coverage (obviously)
- US: 42% of traffic
- IN (India): 33%
- RU (Russia): 7%
- Other: 38% combined
That geographic spread? Classic B2B SaaS pattern. US for the money, India for the volume, scattered global for the long tail. They’re not geo-targeting aggressively, just catching whoever searches for mobile game analytics.
Strategic Opportunities and The Real Competition
So here’s what really struck me after going through all this data – GameRefinery’s playing a different game than most gaming sites. They’re not chasing viral gaming news or trying to rank for “best mobile games 2025.” They’re laser-focused on the B2B angle and that changes everything.
Market Position Reality Check:
GameRefinery’s occupying this weird middle ground. Too small to compete with the big analytics platforms on raw data coverage, but too specialized to be just another gaming blog. Their 2.5K monthly organic visitors? In the B2B SaaS world, that’s actually not terrible for such a narrow niche.
Think about their actual target audience:
- Mobile game product managers (maybe 10,000 globally?).
- Game economy designers (even fewer).
- Mobile gaming analysts at publishers (super specific).
- Competitive intelligence teams at gaming companies
We’re talking about a total addressable market that’s probably smaller than a single suburb’s population. In that context, 2.5K monthly visitors starts looking more respectable.
What’s Actually Working?
After digging through all this, here’s my honest take on their SEO strategy:
The Wins:
- Game deconstruction content – This is their bread and butter. When they tear down a game’s monetization system, people find it, read it, share it
- Evergreen product updates – That April 2020 page still pulling traffic? Golden
- Niche keyword dominance – They own weird specific terms like “uma musume looping”
- Industry credibility – 3,000+ referring domains means people cite them as a source
The Failures:
- Technical performance – 85 HTTP requests is amateur hour
- Over-reliance on liftoff.io – 20K backlinks from one domain is risky as hell
- Content consistency – Gaps in publishing, topics all over the map
- Geographic targeting – No clear focus on high-value markets
Missed Opportunities I’m Seeing:
The biggest miss? They’re not capitalizing on trending games fast enough. By the time they publish a deconstruction, the moment’s often passed. Look at their top pages – April 2020 content still ranking? That means they haven’t refreshed or created better versions.
Speed matters in gaming. When Monopoly GO! launched and made a billion dollars, where was their day-one analysis? When Match-3 games started adding battle passes, did they jump on that trend? The data suggests no.
The Verdict: Specialist Site Doing Specialist Things
Look, GameRefinery isn’t trying to be the next IGN. After reviewing everything, they’re exactly what they appear to be – a niche B2B platform serving a specific slice of the mobile gaming industry.
Overall SEO Health Score: 6.5/10
Here’s my scoring breakdown:
- Technical SEO: 5/10 (those load times and HTTP requests…).
- Content Strategy: 7/10 (great when they publish, but inconsistent).
- Backlink Profile: 6/10 (decent quantity, questionable distribution).
- Keyword Targeting: 8/10 (they know their niche).
- User Experience: 6/10 (functional but not optimized).
For a site in their position, that’s… fine? They’re not bleeding traffic, they’re maintaining their niche and they’re recognized in their industry. But there’s so much low-hanging fruit here it’s practically touching the ground.
If I Was Running Their SEO Tomorrow:
First thing – fix those HTTP requests. Consolidate scripts, implement lazy loading, get that page load under 50 requests. Easy wins.
Second – content calendar tied to game launches. Every major mobile game launch should trigger a deconstruction within 72 hours. Speed wins in gaming content.
Third – diversify that backlink profile. One domain providing 40% of your links? That’s a disaster waiting to happen.
Fourth – double down on what works. Those game monetization breakdowns are gold. Do more, do them faster, do them better.
Final Thoughts
GameRefinery’s in an interesting spot. They’ve carved out a niche in mobile gaming analytics that sits between consumer gaming content and enterprise analytics platforms. The SEO data shows they’re holding that position but not really growing it.
The thing is, in B2B niches like this, you don’t need millions of visitors. You need the RIGHT visitors. A single product manager from King or Supercell reading their analysis could be worth more than 10,000 random gamers.
Their SEO isn’t spectacular, but it doesn’t need to be. It just needs to be good enough to keep them visible to their specific audience. Right now? They’re achieving that. Could they do better? Absolutely. But for a niche B2B platform in the gaming intelligence space, they’re doing exactly what they need to do – staying relevant, staying visible and staying in the conversation.