Restaurant data analytics is the process of collecting, organizing, and studying data generated in a restaurant to make better decisions. This can include information from sales, customer feedback, employee performance, food waste, menu popularity, and more. When done correctly, it helps restaurants improve profits, reduce waste, and provide better service.
- What is Restaurant Data Analytics?
- Restaurant Data Analytics Solutions
- What Are Restaurant Data Analytics Solutions?
- Restaurant Data Analytics Project Solutions
- Loading the Data
- Data Cleaning
- Exploratory Data Analysis (EDA) Restaurants
- Location-Based Insights
- Menu Analysis & Price vs Rating
- What Do These Solutions Include?
- 1. Sales and POS Analytics
- 2. Customer Behavior Insights
- 3. Inventory and Waste Management
- 4. Staff Performance and Scheduling
- 5. Real-Time Dashboards and Reports
- Why Restaurant Data Analytics Solutions Matter: Key Business Benefits Explained
- Types of Data Analytics in Restaurants
- Why Restaurant Data Analytics Should Use Data Analytics
- Experience-Based Restaurant Data Analytics Case Studies
- Case 1: Reducing Food Waste in a Busy Downtown Diner
- Case 2: Boosting Customer Return Rate for a Family Restaurant
- Case 3: Improving Staff Performance at a Mid-Sized Bistro
- Case 4: Menu Rebuild for a Small Café
- Case 5: Handling Negative Reviews with Data
- 12 Benefits of Using Restaurant Analytics
- Ensuring Better Quality Control
- Enhancing Food Delivery Efficiency
- Managing Franchise Performance at Scale
- Adjusting Meal Portions with Precision
- Personalizing the Customer Experience
- Reducing Food Waste and Saving Money
- Optimizing the Layout and Use of Space
- Targeting Customers More Effectively
- Choosing the Best Restaurant Location
- Understanding Regional Taste Preferences
- Collecting and Acting on Customer Feedback
- Making Smarter Menu Decisions
- Top Restaurant Data Analytics Service Providers
What is Restaurant Data Analytics?
Running a restaurant is more than just serving great food — it’s juggling menus, staff, customers, costs, and a hundred little things that can make or break your day. That’s where restaurant data analytics comes in.
Think of it as your restaurant’s “superpower” — a behind-the-scenes tool that helps you understand what’s really happening in your business by turning everyday info into useful insights.
It takes the data you’re already collecting — like:
- What dishes are selling the most (or least)
- What time your tables fill up
- Which servers bring in the biggest tips
- When you’re overstaffed or understaffed
- What ingredients are being wasted
- Which promotions are actually working
Restaurant Data Analytics Solutions
Exploring trends, insights, and opportunities in restaurant performance
What Are Restaurant Data Analytics Solutions?
Restaurant Data Analytics Solutions refer to the tools, technologies, and processes that help restaurant owners and managers understand what’s really happening in their business by analyzing data. These solutions collect, organize, and visualize information—from sales and customer behavior to inventory and staffing—giving you the power to make informed, data-driven decisions every day.
Instead of relying on guesswork, these solutions help restaurants operate more efficiently, serve better experiences, and boost profitability.
Restaurant Data Analytics Project Solutions
This project explores a restaurant dataset to extract actionable business insights using Python, pandas, and visualization tools. We’ll walk through key steps like:
- Loading and cleaning data
- Exploratory Data Analysis (EDA)
- Visualizing trends and patterns
- Key insights and takeaways
Loading the Data
We start by importing the dataset using Python and pandas:
pythonCopyEditimport pandas as pd

df = pd.read_csv('restaurant_data.csv')
df.head()
This gives us a glimpse of the raw data — fields like restaurant name, location, ratings, number of customers, and more.
Data Cleaning
Next, we check for missing or incorrect values and clean the dataset:
pythonCopyEdit# Check for missing values
df.isnull().sum()

# Drop or fill missing values
df = df.dropna(subset=['rating', 'price_range'])
Exploratory Data Analysis (EDA) Restaurants
Let’s uncover some basic trends:
Charts: Exploratory Data Analysis Restaurants
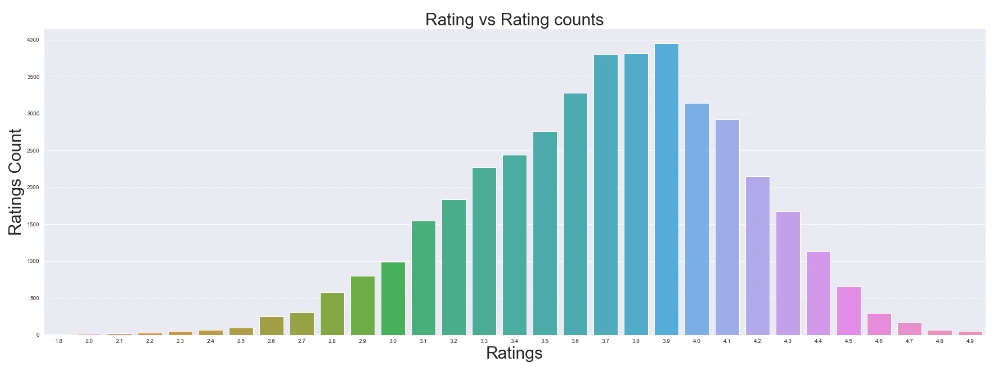
- Distribution of Restaurant Ratings
- Number of Restaurants by Price Range
This part of the analysis helps us explore:
- Which rating ranges are most common
- The balance between budget, mid-range, and premium restaurants
- Correlations between price level and customer satisfaction
Location-Based Insights
To understand where restaurants are concentrated:
pythonCopyEditgrouped = df.groupby('city')['restaurant_id'].count().sort_values(ascending=False)
grouped.head(10)
Chart: Top 10 Cities by Number of Restaurants
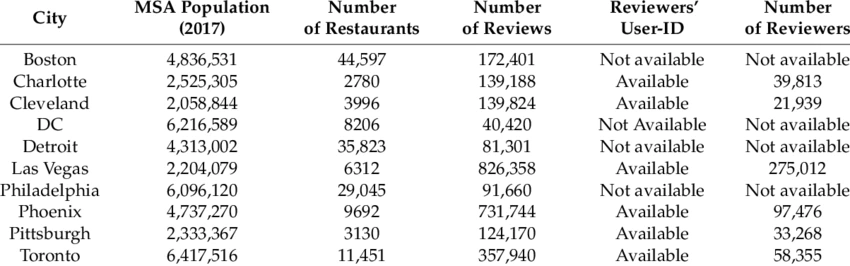
This helps identify markets with high restaurant density and potential opportunities.
Menu Analysis & Price vs Rating
Here, we analyze the relationship between price range and customer ratings.
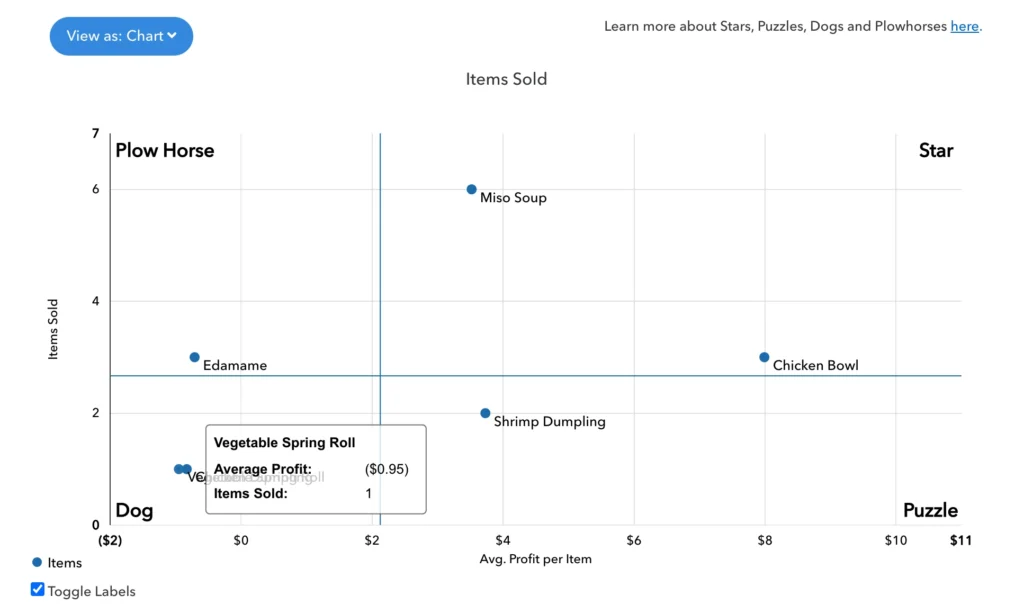
This visualization helps determine:
- Whether higher prices yield better ratings
- If there are “sweet spots” in mid-range pricing where customer satisfaction is high
What Do These Solutions Include?
1. Sales and POS Analytics
Tracks every order to show:
- Which items are most profitable
- What times of day are busiest
- Which payment methods customers prefer
2. Customer Behavior Insights
Analyzes feedback, reviews, and ordering patterns to:
- Understand guest preferences
- Reward loyalty
- Personalize marketing
3. Inventory and Waste Management
Monitors food usage and spoilage to:
- Avoid over-ordering
- Reduce food waste
- Save money on stock
4. Staff Performance and Scheduling
Uses shift data and sales trends to:
- Optimize staffing levels
- Improve employee efficiency
- Reduce overtime and understaffing
5. Real-Time Dashboards and Reports
Visual dashboards show key performance indicators (KPIs) at a glance, such as:
- Daily sales
- Table turnover rates
- Food cost percentages
- Customer satisfaction scores
Why Restaurant Data Analytics Solutions Matter: Key Business Benefits Explained
- Make smarter decisions faster
Quickly identify what’s working and what’s not, and adjust with confidence. - Improve operations
Run smoother shifts, maintain better inventory control, and reduce chaos during rush hours. - Enhance customer experience
Serve what people love, deliver faster service, and build deeper loyalty. - Drive profitability
Boost margins by improving efficiency, pricing right, and promoting wisely.
Types of Data Analytics in Restaurants

- Sales Data
- Daily revenue
- Peak sales hours
- Best-selling items
- Payment methods
- Customer Data
- Number of repeat customers
- Table turnover time
- Order preferences
- Feedback scores
- Inventory Data
- Daily ingredient usage
- Wasted stock
- Supplier performance
- Delivery delays
- Employee Data
- Hours worked
- Sales per employee
- Absenteeism rate
- Table service efficiency
- Marketing Data
- Promo performance
- Social media engagement
- Email open rates
- Loyalty program usage
Why Restaurant Data Analytics Should Use Data Analytics

Restaurants that use data analytics are better equipped to face challenges. It reduces guesswork and helps understand what really works. Here are some reasons it’s helpful:
- Improves cost control by identifying waste
- Enhances customer satisfaction by tracking feedback
- Helps in staff scheduling by observing busy hours
- Boosts marketing effectiveness by tracking campaign results
Data Sources and Their Uses
| Data Source | Key Use |
|---|---|
| POS System | Tracks sales and order types |
| Reservation App | Shows customer preferences |
| Inventory System | Measures ingredient usage |
| Online Reviews | Captures customer satisfaction |
| Employee Scheduler | Monitors staffing efficiency |
Experience-Based Restaurant Data Analytics Case Studies
Case 1: Reducing Food Waste in a Busy Downtown Diner
A downtown diner noticed high food costs despite steady sales. By using data analytics from their inventory system and POS, they found that ingredients like lettuce and tomatoes were being over-ordered and spoiling before use.
Steps Taken:
- Compared daily ingredient usage with sales of dishes containing those ingredients
- Reduced reorder amounts
- Trained staff to use fresher items first
- Tracked waste by day to notice trends
Results:
- Reduced waste by 40% in 3 months
- Saved $1,200 monthly on produce costs
Lessons Learned:
- Tracking ingredient-level waste can uncover cost-saving opportunities
- Simple changes based on data can have a big impact
Case 2: Boosting Customer Return Rate for a Family Restaurant
A family-style restaurant wanted more repeat visits. By using analytics from their reservation app and loyalty program, they identified the best times to send promotions.
Key Observations:
- Customers who dined on weekends were less likely to return
- Weekday lunch visitors were highly loyal
Solutions Applied:
- Sent targeted weekday lunch offers to past visitors
- Gave weekend diners follow-up discounts
- Measured which offers led to bookings
Outcome:
- 25% increase in weekday lunch visits
- Loyalty member engagement up by 50%
Tips for Better Customer Retention Using Data:
- Segment customers based on dining patterns
- Tailor promotions to different customer types
- Monitor the response rate to each offer
Promotion Testing Results
| Offer Type | Response Rate | Booking Increase |
| Weekday Lunch Deal | 42% | +25% |
| Weekend Discount | 18% | +12% |
| Free Dessert Coupon | 9% | +5% |
Case 3: Improving Staff Performance at a Mid-Sized Bistro
A bistro was receiving mixed reviews about service speed. They used employee shift and sales data to assess performance.
Approach:
- Measured average table time by server
- Linked reviews to server shifts
- Identified slow vs fast service patterns
What They Did:
- Offered training to underperforming servers
- Adjusted shift lengths for high-performers
- Introduced small rewards for quick table turnovers
Impact:
- Service complaints dropped by 60%
- Server efficiency improved by 20%
- Tips increased for top-performing staff
Employee Performance Table
| Server Name | Avg. Table Time | Customer Rating | Action Taken |
| Jake | 30 min | 3.2 | Training |
| Leah | 22 min | 4.7 | Reward + Extra Shift |
| Amir | 26 min | 4.1 | No change |
Real Tips to Use Data Better in Your Restaurant
- Don’t collect everything. Focus on what helps most: cost, customers, staff.
- Review reports weekly. Waiting too long hides problems.
- Use charts to compare week over week.
- Set small improvement goals, like cutting dessert waste by 10%.
Questions to Ask Your Data
- Which menu items have the lowest profit margin?
- When are my busiest and slowest hours?
- Who are my top 5 returning customers?
- Which staff members serve the most tables per hour?
- What food items get returned most often?
Common Data Mistakes and How to Fix Them
| Mistake | Fix |
| Tracking too much | Focus on 5-7 KPIs |
| Ignoring customer comments | Categorize feedback into themes |
| Not reviewing often enough | Create a weekly review habit |
| No clear goals | Tie every data point to a goal |
| Data stored in many places | Use one dashboard or report sheet |
Case 4: Menu Rebuild for a Small Café
A café noticed that despite high ratings, some dishes barely sold. They used 6 months of POS data to analyze item popularity and profit margins.
Actions Taken:
- Removed 5 low-sellers
- Added 3 new options with similar ingredients to top-sellers
- Increased price slightly for top 3 dishes
Results:
- Menu more focused
- Sales up 18%
- Prep time down by 15 minutes per shift
Menu Optimization Table
| Dish Name | Monthly Sales | Profit Margin | Kept or Removed |
| Tuna Melt | 22 | 12% | Removed |
| Avocado Toast | 130 | 38% | Kept |
| BLT Wrap | 80 | 28% | Kept |
| Chicken Salad | 15 | 10% | Removed |
Helpful Advice from Experts
Maggie R., Café Consultant: “Look at what customers reorder. That tells you more than any review.”
James W., Restaurant Accountant: “Always match sales data with supplier costs. A dish can be popular but still lose you money.”
Tasha L., General Manager: “Employees like being part of the process. Share key stats with them weekly.”
How to Start with Restaurant Data Analytics
- Choose 3 main areas: Sales, Customers, and Operations
- Set one goal for each: more orders, more returns, fewer errors
- Use simple tools like spreadsheets or basic dashboard apps
- Review every week and write a one-page summary
- Test one change at a time and record the result
Free Tools You Can Use
| Tool Name | Use Case | Free Features |
| Google Sheets | Data tracking | Charts, sharing, formulas |
| Square POS | Sales & item data | Item tracking, reports |
| Yelp for Business | Customer feedback | Reviews & trends |
| Canva | Visual dashboards | Free templates |
| Trello | Tracking action items | Task boards |
Creating a Data-Friendly Restaurant Culture
- Talk about results in team meetings
- Reward improvements with simple perks
- Keep dashboards visible in staff areas
- Encourage suggestions from staff based on numbers
How Often Should You Review Data?
| Time Frame | Suggested Review Activity |
| Daily | Look at sales and complaints |
| Weekly | Check inventory and staff hours |
| Monthly | Review top items and waste |
| Quarterly | Full review of performance |
Case 5: Handling Negative Reviews with Data
A restaurant received several poor reviews in one month. Instead of replying defensively, they studied the reviews and matched them with staff schedules and order data.
Findings:
- Most bad reviews were on Monday nights
- New staff was on shift those nights
- Kitchen delays were 3x longer
Response:
- Paired new staff with experienced employees
- Added one extra kitchen staff member on Mondays
- Tracked changes in reviews after adjustments
Outcome:
- Negative reviews dropped
- Monday sales stabilized
12 Benefits of Using Restaurant Analytics
How data is transforming the dining experience for both customers and restaurant owners
Restaurant analytics is revolutionizing how restaurants operate — from kitchens and menus to marketing and customer experience. By turning numbers into actionable insights, data analytics empowers restaurants to grow smarter, leaner, and more personalized. It’s not just about crunching numbers — it’s about making everyday decisions easier and more effective.
Here are A Some bENEFITS data analytics is reshaping the restaurant industry.
Ensuring Better Quality Control
Data analytics gives restaurants greater control over food quality by monitoring every step of the supply chain. For sensitive items like dairy, fresh produce, or frozen goods, IoT-powered sensors track temperature and humidity conditions in real time. This helps ensure food remains fresh during transportation and storage. If anything goes wrong, alerts can signal damaged or spoiled products before they ever reach a customer.
Enhancing Food Delivery Efficiency
In today’s on-demand world, timely delivery is essential. Analytics tools help restaurants optimize delivery routes by factoring in real-time traffic, weather conditions, and driver performance. This ensures meals arrive faster and fresher — keeping both food quality and customer satisfaction high.
Managing Franchise Performance at Scale
Franchise operators often manage dozens or hundreds of locations. With centralized, cloud-based analytics, they can monitor customer behavior, operational costs, and sales trends across all outlets. This broad view helps them spot best practices, uncover underperforming stores, and make strategic decisions that strengthen the brand.
Adjusting Meal Portions with Precision
Not every location or customer base has the same expectations when it comes to portion size. Using analytics, restaurant owners can assess sales, customer feedback, and waste data to determine the most efficient and satisfying serving sizes — reducing both excess food and customer complaints.
Personalizing the Customer Experience
Modern tools like mobile apps, digital kiosks, and table-side tablets don’t just make ordering easier — they collect valuable customer data. With this information, restaurants can tailor experiences, offer personalized promotions, suggest favorite dishes, and even greet repeat customers by name. It’s about turning one-time guests into loyal fans.
Reducing Food Waste and Saving Money
Food waste is a serious cost for restaurants — both financially and environmentally. Data analytics helps restaurants monitor inventory and sales patterns so they can order smarter and avoid overstocking. It also allows suppliers to align deliveries with real-time demand, reducing spoilage and unnecessary expenses.
Optimizing the Layout and Use of Space
Data-gathering sensors inside restaurants can track customer movement and traffic flow — revealing which areas get crowded, which seats are used least, and how guests interact with the space. This insight allows owners to improve the floor plan, reduce bottlenecks, and create a more comfortable dining environment.
Targeting Customers More Effectively
By segmenting customers based on traits like age, gender, spending habits, and visit frequency, restaurants can fine-tune their marketing strategies. Instead of sending the same message to everyone, data allows you to create targeted offers and personalized outreach that actually resonate with each group.
Choosing the Best Restaurant Location
Location can make or break a restaurant. Predictive analytics uses data like population density, foot traffic, competitor proximity, and local dining trends to help restaurant owners choose the most promising locations for new stores. This reduces guesswork and increases the odds of long-term success.
Understanding Regional Taste Preferences
Customer preferences vary widely by region, and analytics can uncover those local tastes. By identifying “taste clusters” — regional or time-based patterns in food preferences — restaurants can adjust their menus or marketing to cater to what people in a particular area crave most, improving both satisfaction and sales.
Collecting and Acting on Customer Feedback
From online reviews to mobile surveys, customer feedback is more accessible than ever — but only if it’s analyzed effectively. Data analytics helps restaurants gather this input across multiple channels, analyze it quickly, and take meaningful action to improve service, food quality, or ambiance based on what guests actually say.
Making Smarter Menu Decisions
Creating the perfect menu is part art, part science. Data analytics helps take the guesswork out of it. By examining which dishes are frequently ordered, which are rarely touched, and which generate the most profit, restaurant owners can update their menus with confidence. It also helps in testing new items, pricing adjustments, and even redesigning how dishes are displayed to increase visibility and sales.
Top Restaurant Data Analytics Service Providers
- https://programmatic.llc/restaurant-data-analytics-services
- https://www.gotenzo.com/resources/insight/the-ultimate-guide-to-restaurant-data-and-analytics/
- https://www.nobledesktop.com/classes-near-me/blog/data-analytics-in-restaurants
- https://wavicledata.com/restaurant-data-analytics/
- https://get.apicbase.com/restaurant-analytics-software/
Final Thoughts
Restaurant analytics isn’t just a tech trend — it’s a powerful tool for growth, efficiency, and customer satisfaction. By collecting and analyzing data, restaurant owners gain valuable insights into every aspect of their business. From improving food quality and reducing waste to personalizing experiences and choosing the right location, data analytics turns everyday challenges into opportunities for success.
As the restaurant industry continues to evolve, those who embrace data will be the ones who lead — creating better experiences for customers and building stronger, more resilient businesses.